Running Prometheus & Grafana
Install Prometheus & Grafana
This is an example deployment that includes Prometheus and Grafana in a single deployment.
The default installation contains:
Grafana: A visualization dashboard with Cilium Dashboard pre-loaded.
Prometheus: a time series database and monitoring system.
$ kubectl apply -f https://raw.githubusercontent.com/cilium/cilium/1.15.4/examples/kubernetes/addons/prometheus/monitoring-example.yaml
namespace/cilium-monitoring created
serviceaccount/prometheus-k8s created
configmap/grafana-config created
configmap/grafana-cilium-dashboard created
configmap/grafana-cilium-operator-dashboard created
configmap/grafana-hubble-dashboard created
configmap/prometheus created
clusterrole.rbac.authorization.k8s.io/prometheus unchanged
clusterrolebinding.rbac.authorization.k8s.io/prometheus unchanged
service/grafana created
service/prometheus created
deployment.apps/grafana created
deployment.apps/prometheus created
This example deployment of Prometheus and Grafana will automatically scrape the Cilium and Hubble metrics. See the Monitoring & Metrics configuration guide on how to configure a custom Prometheus instance.
Deploy Cilium and Hubble with metrics enabled
Cilium, Hubble, and Cilium Operator do not expose metrics by
default. Enabling metrics for these services will open ports 9962, 9965,
and 9963 respectively on all nodes of your cluster where these components
are running.
The metrics for Cilium, Hubble, and Cilium Operator can all be enabled independently of each other with the following Helm values:
prometheus.enabled=true: Enables metrics forcilium-agent.
operator.prometheus.enabled=true: Enables metrics forcilium-operator.
hubble.metrics.enabled: Enables the provided list of Hubble metrics. For Hubble metrics to work, Hubble itself needs to be enabled withhubble.enabled=true. See Hubble exported metrics for the list of available Hubble metrics.
Refer to Monitoring & Metrics for more details about the individual metrics.
Setup Helm repository:
helm repo add cilium https://helm.cilium.io/
Deploy Cilium via Helm as follows to enable all metrics:
helm install cilium cilium/cilium --version 1.15.4 \
   --namespace kube-system \
   --set prometheus.enabled=true \
   --set operator.prometheus.enabled=true \
   --set hubble.enabled=true \
   --set hubble.metrics.enableOpenMetrics=true \
   --set hubble.metrics.enabled="{dns,drop,tcp,flow,port-distribution,icmp,httpV2:exemplars=true;labelsContext=source_ip\,source_namespace\,source_workload\,destination_ip\,destination_namespace\,destination_workload\,traffic_direction}"
Note
You can combine the above Helm options with any of the other installation guides.
How to access Grafana
Expose the port on your local machine
kubectl -n cilium-monitoring port-forward service/grafana --address 0.0.0.0 --address :: 3000:3000
Access it via your browser: http://localhost:3000
How to access Prometheus
Expose the port on your local machine
kubectl -n cilium-monitoring port-forward service/prometheus --address 0.0.0.0 --address :: 9090:9090
Access it via your browser: http://localhost:9090
Examples
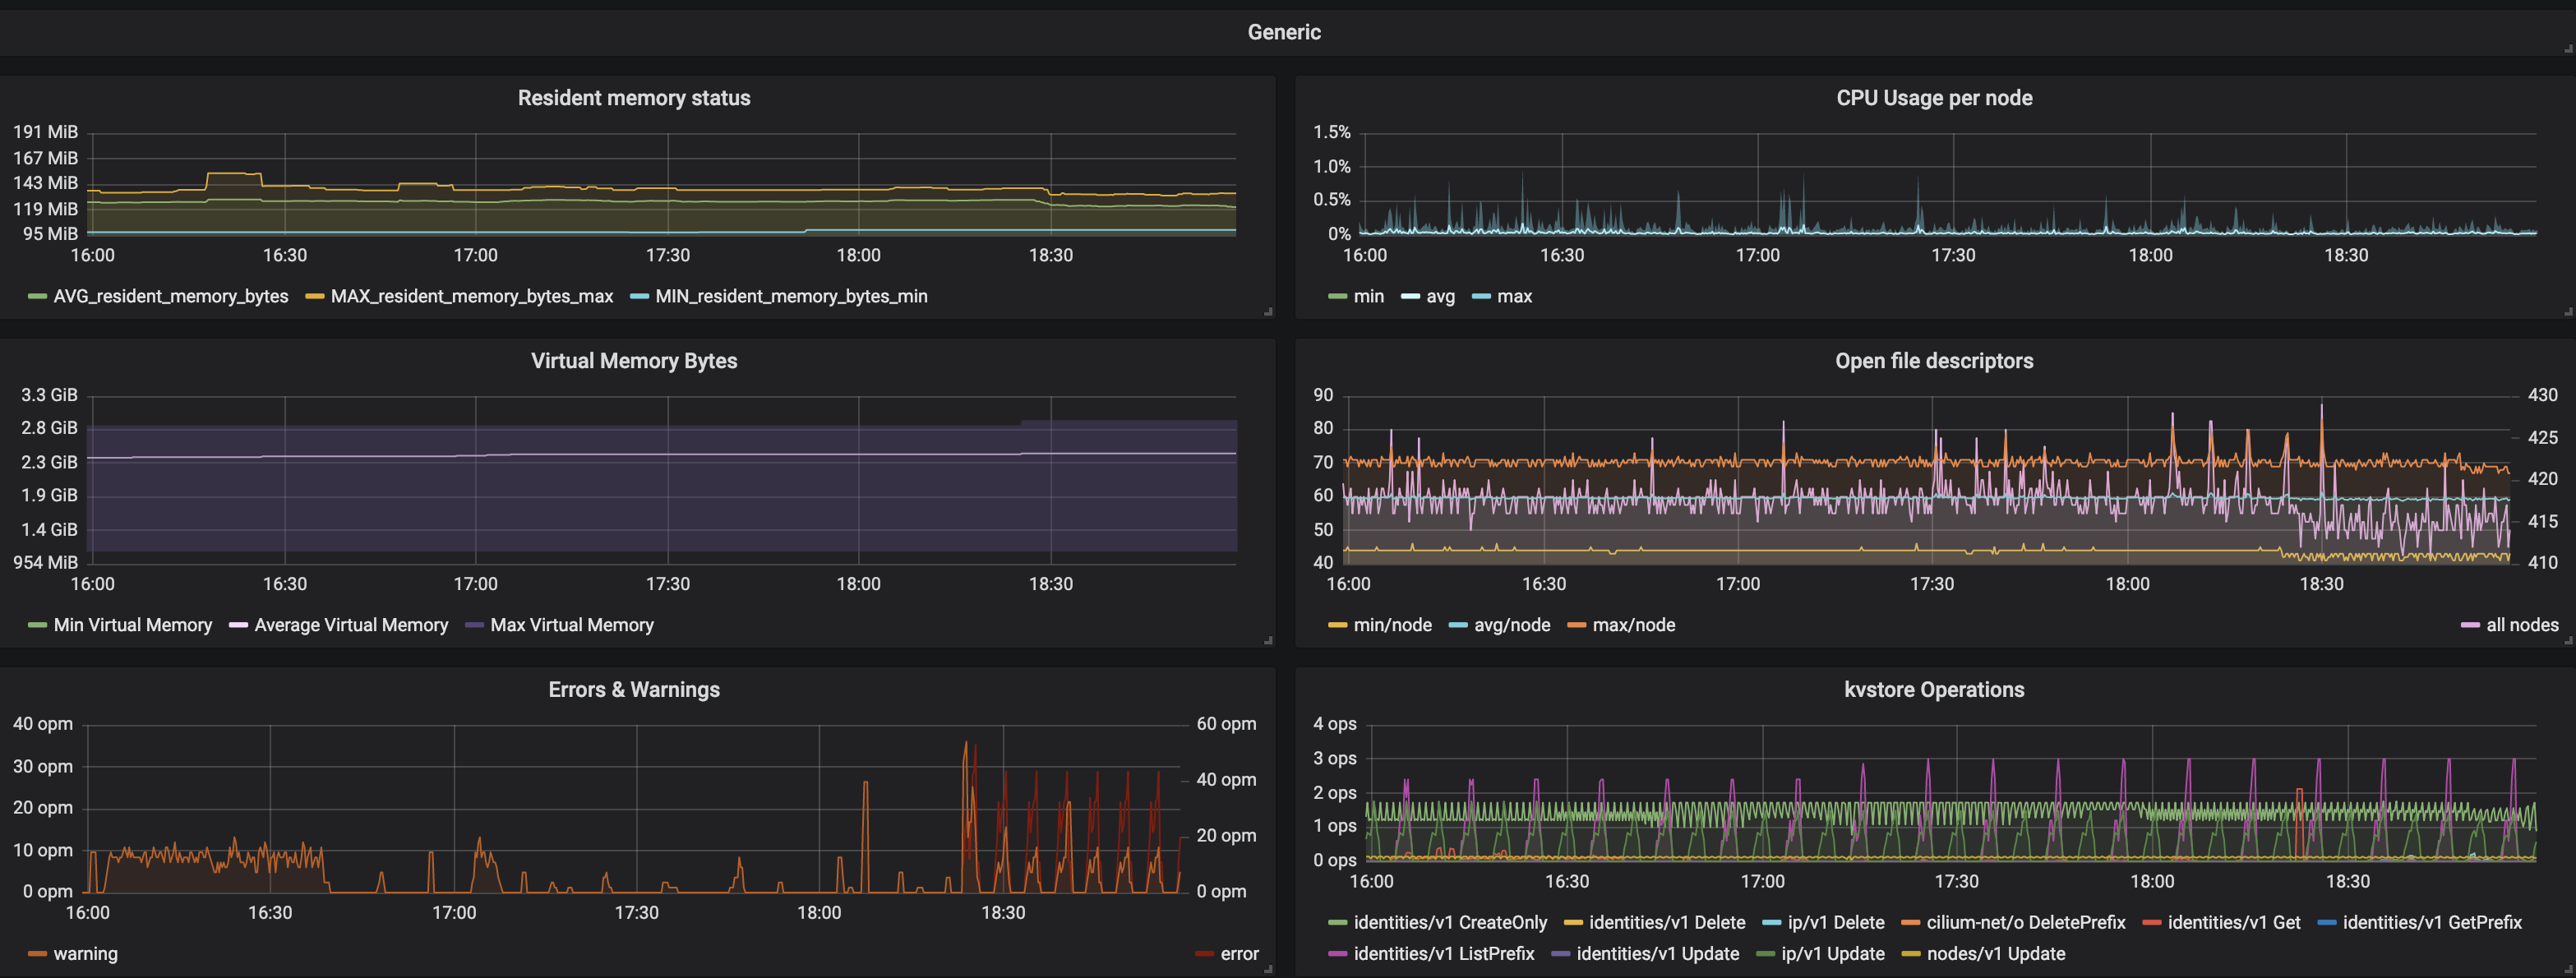
Generic
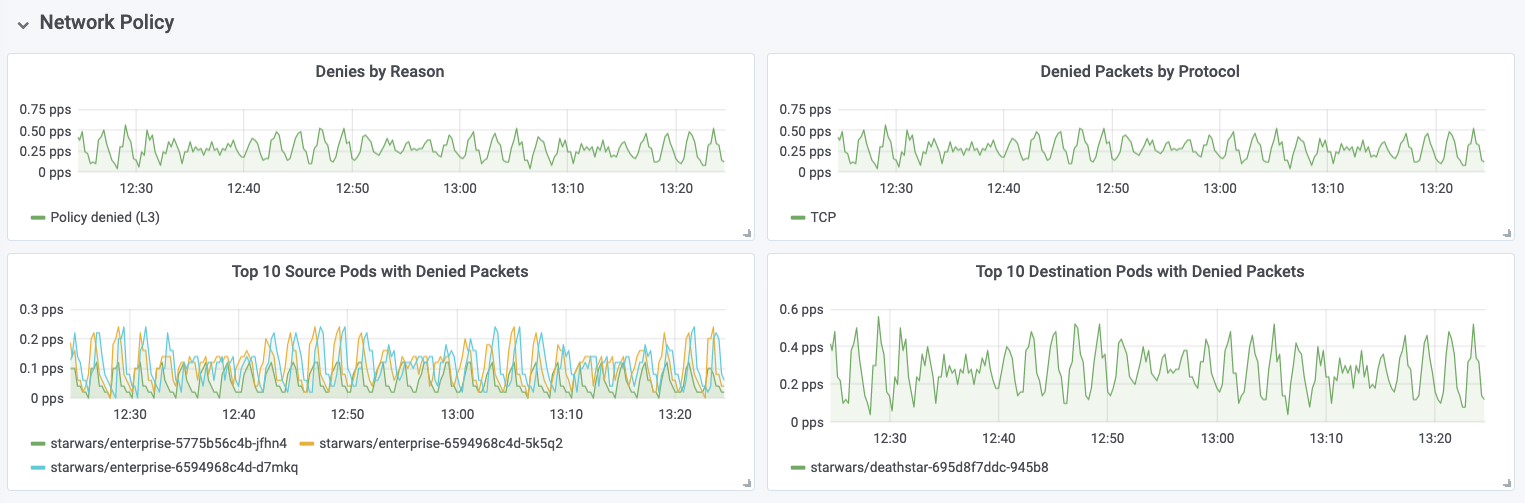
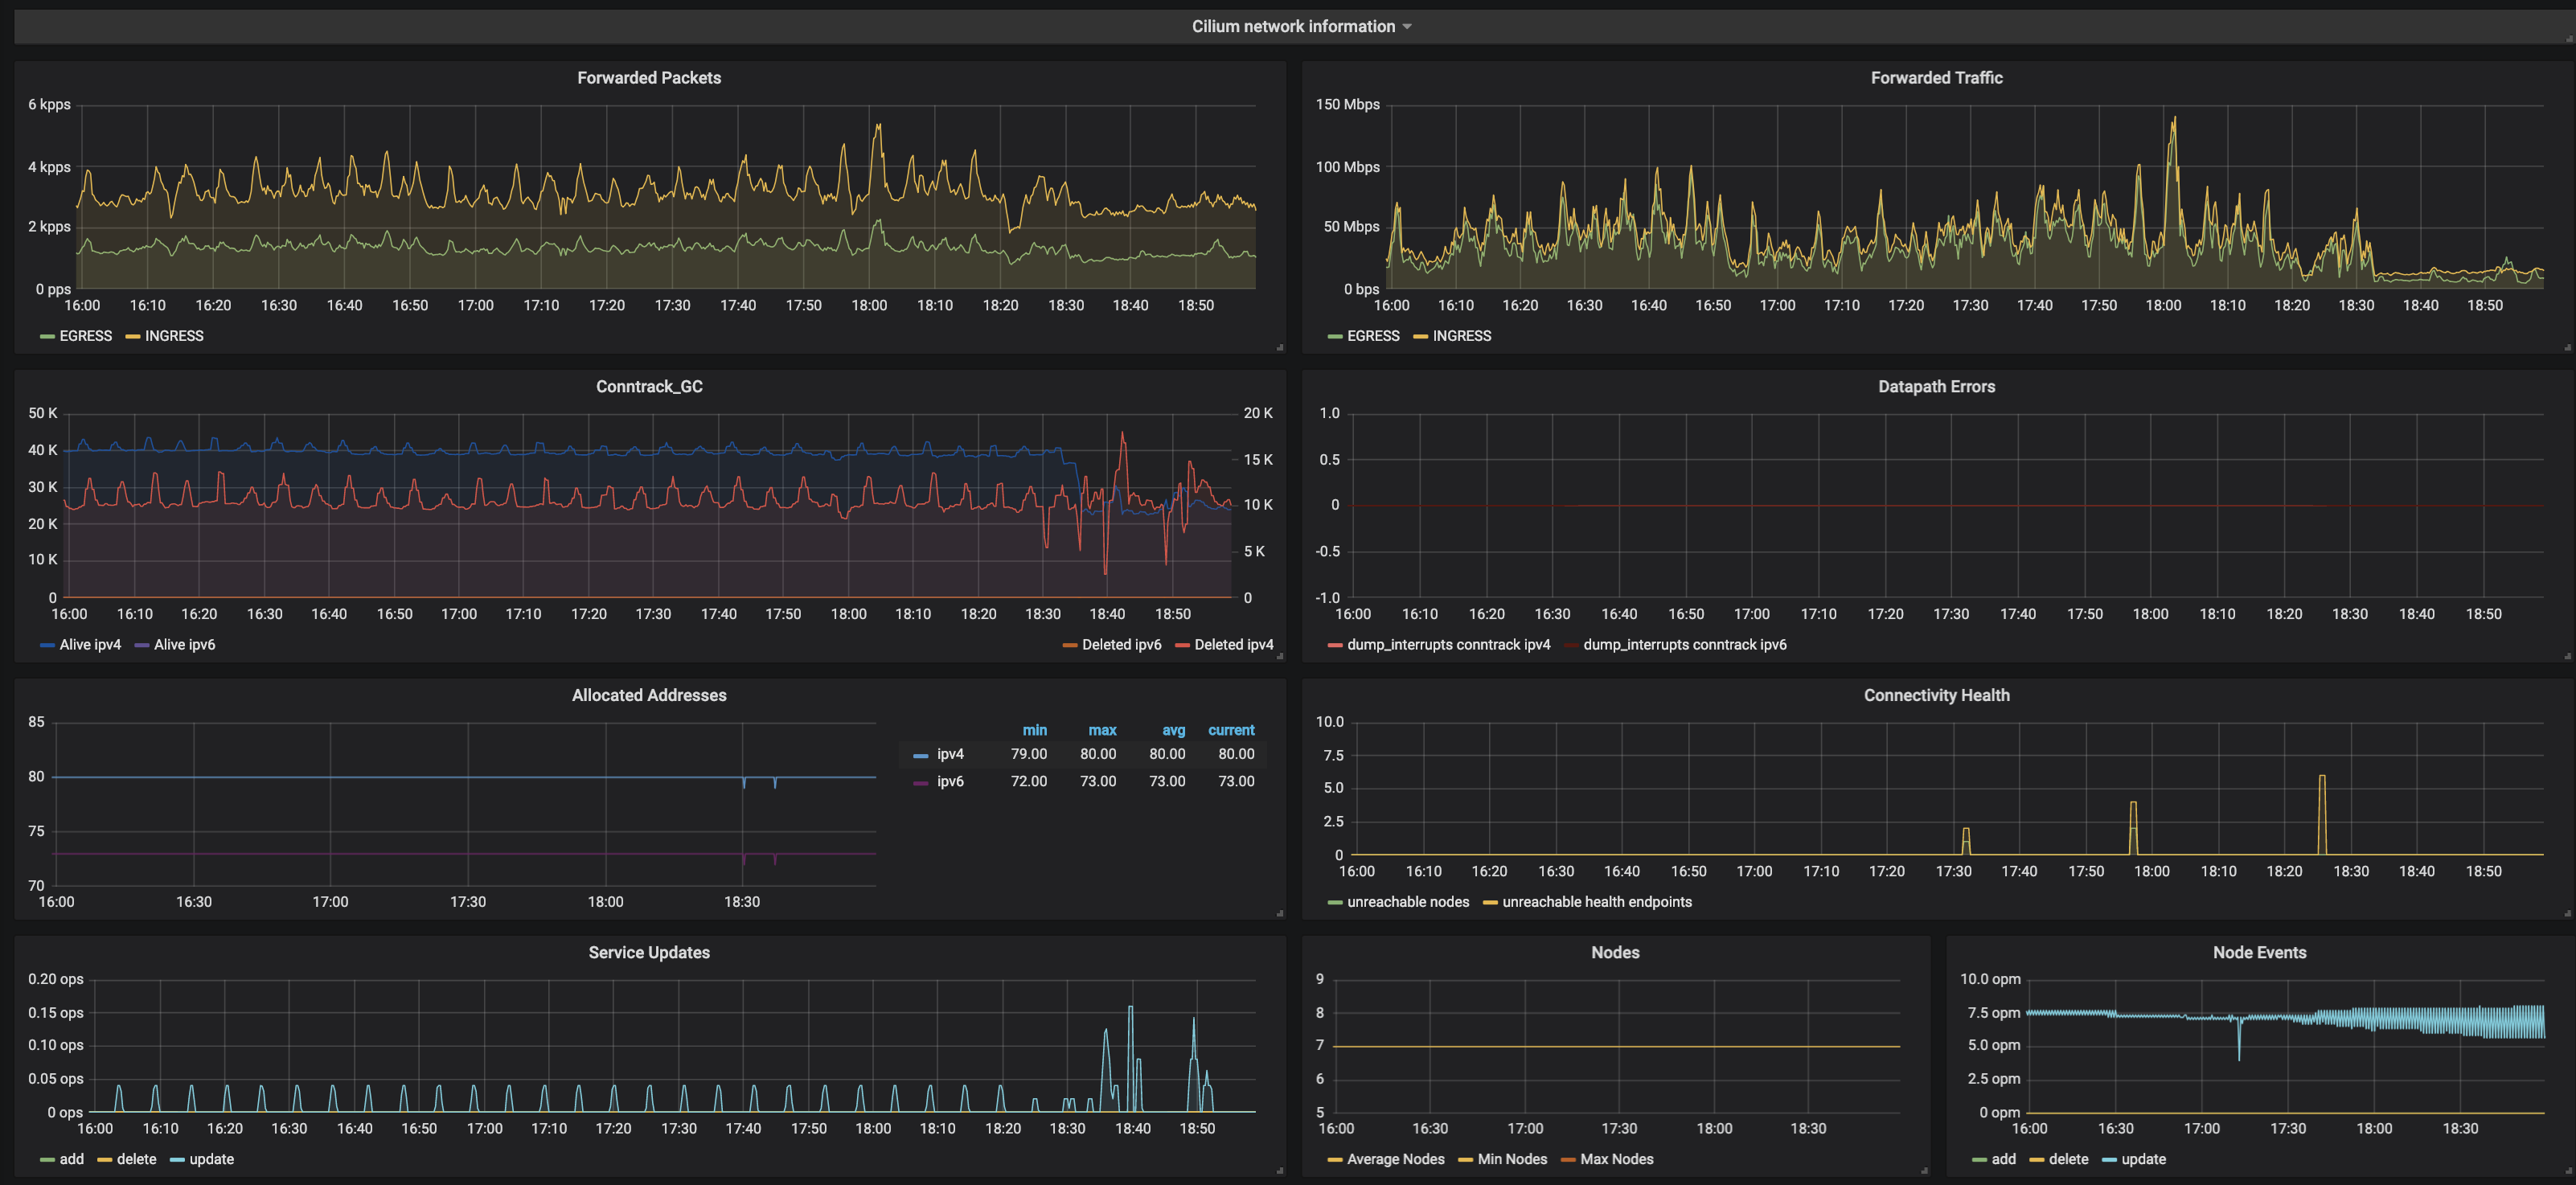
Network
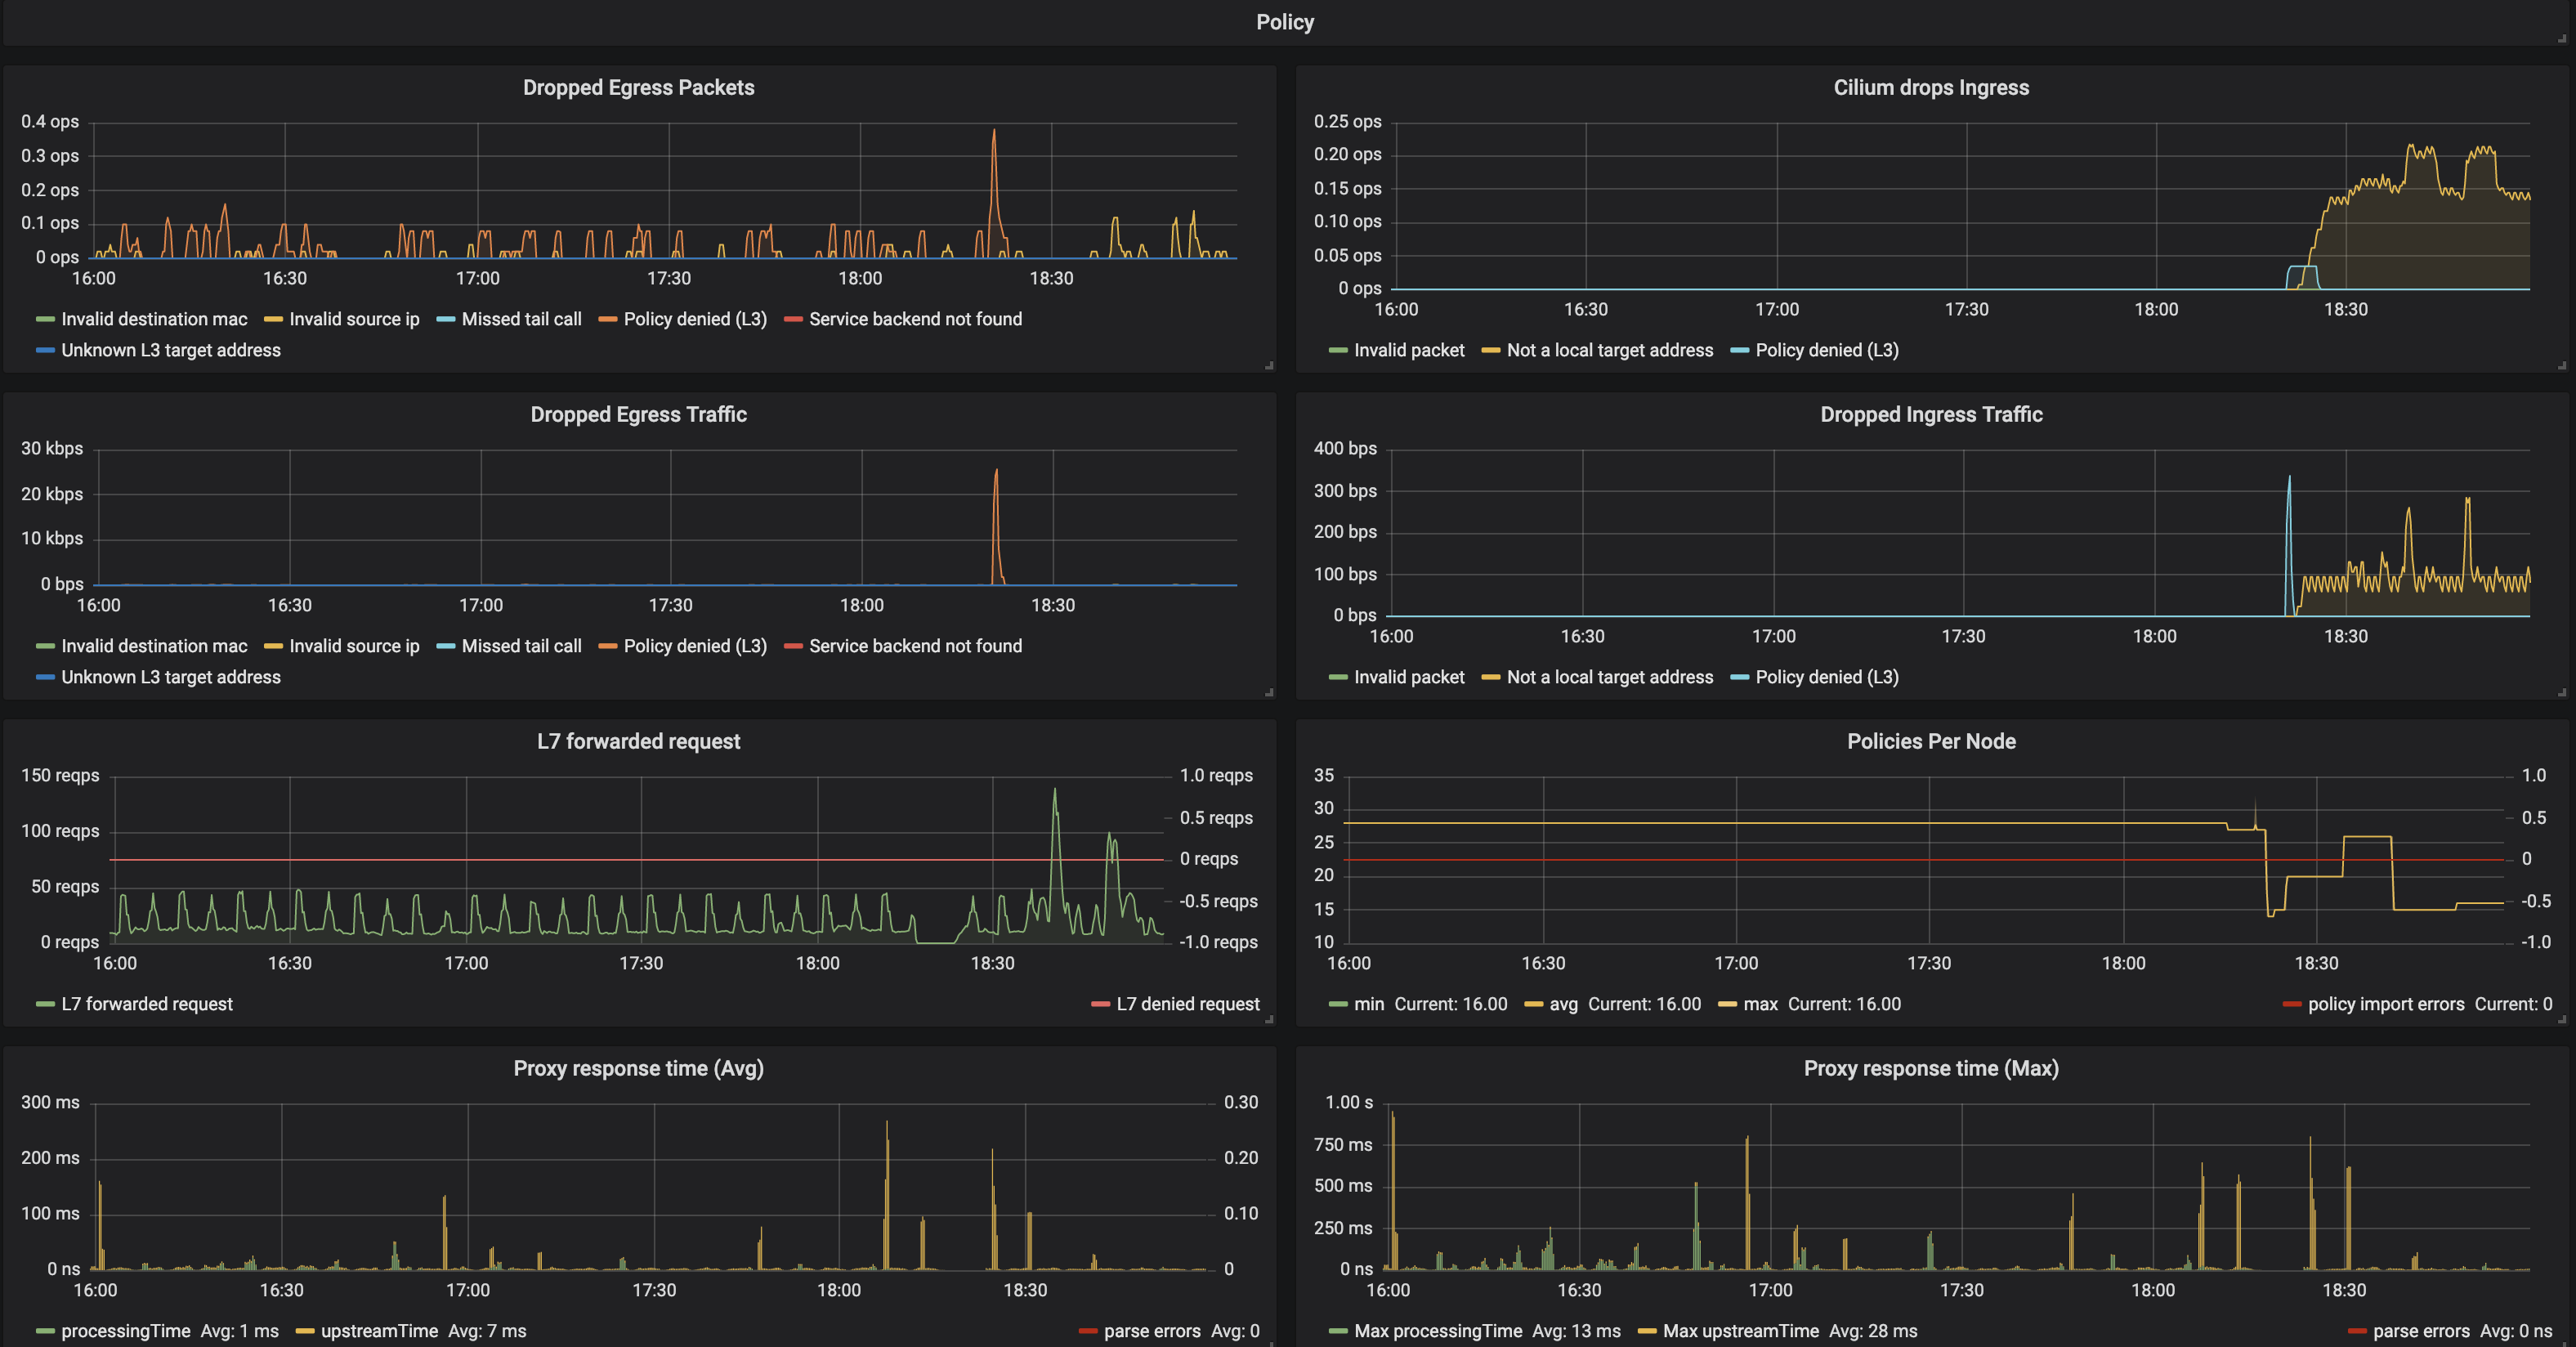
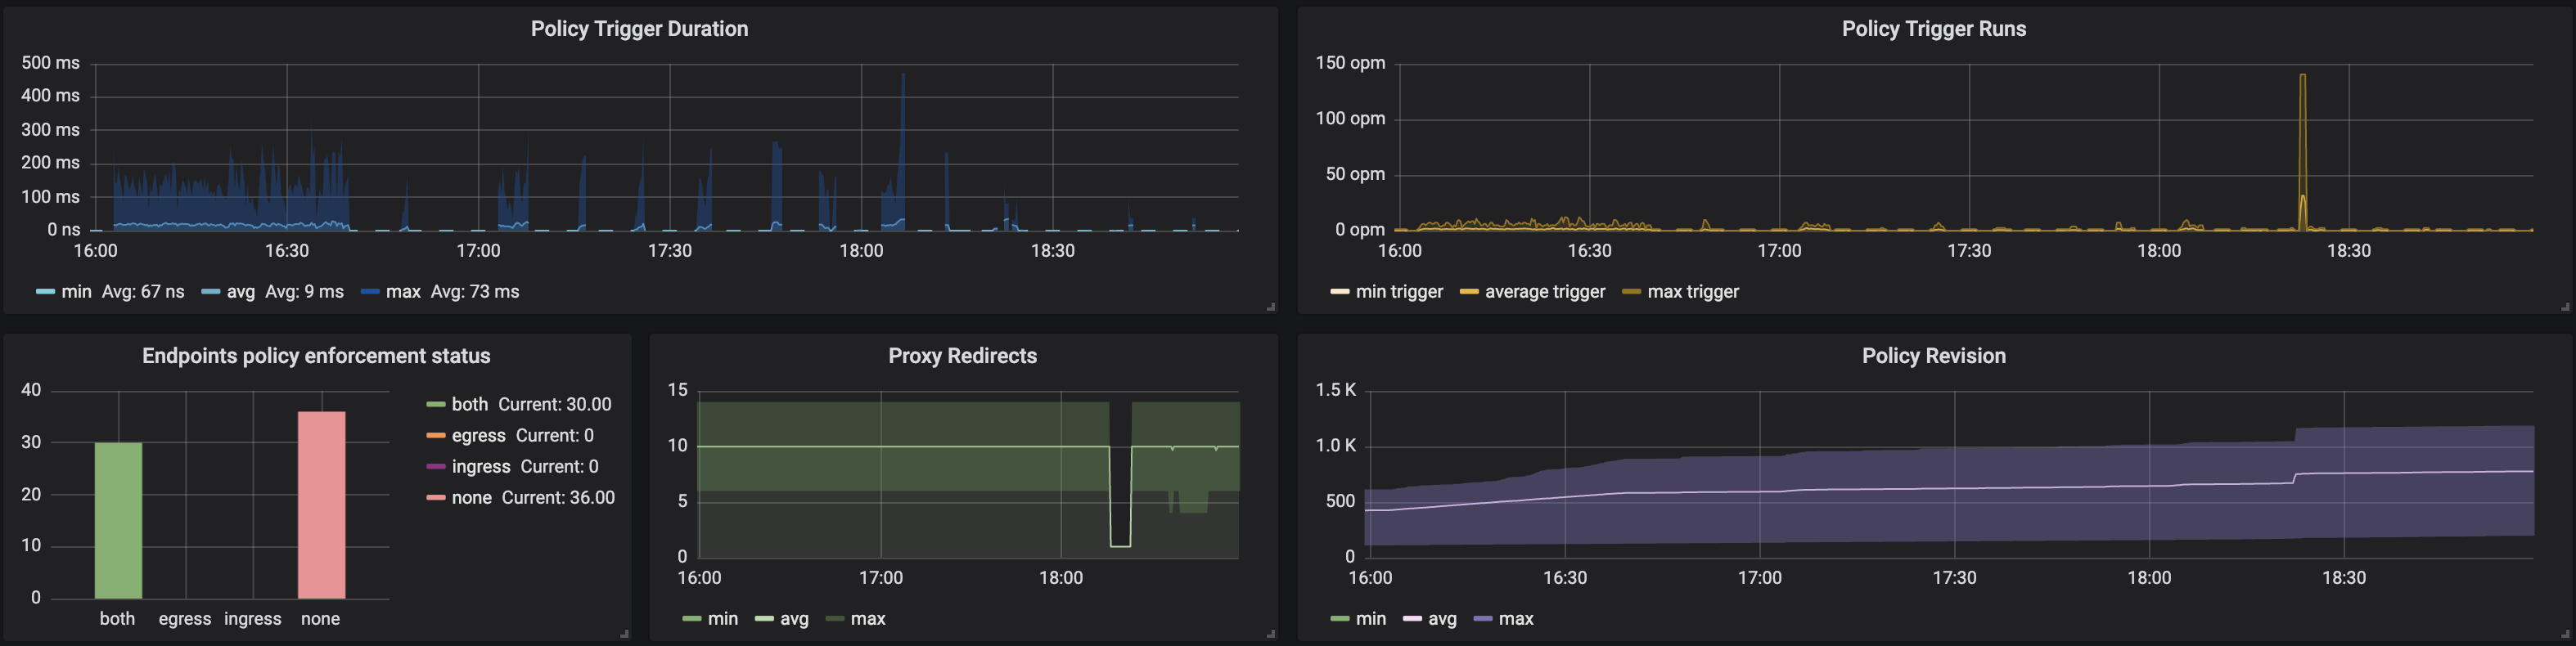
Policy
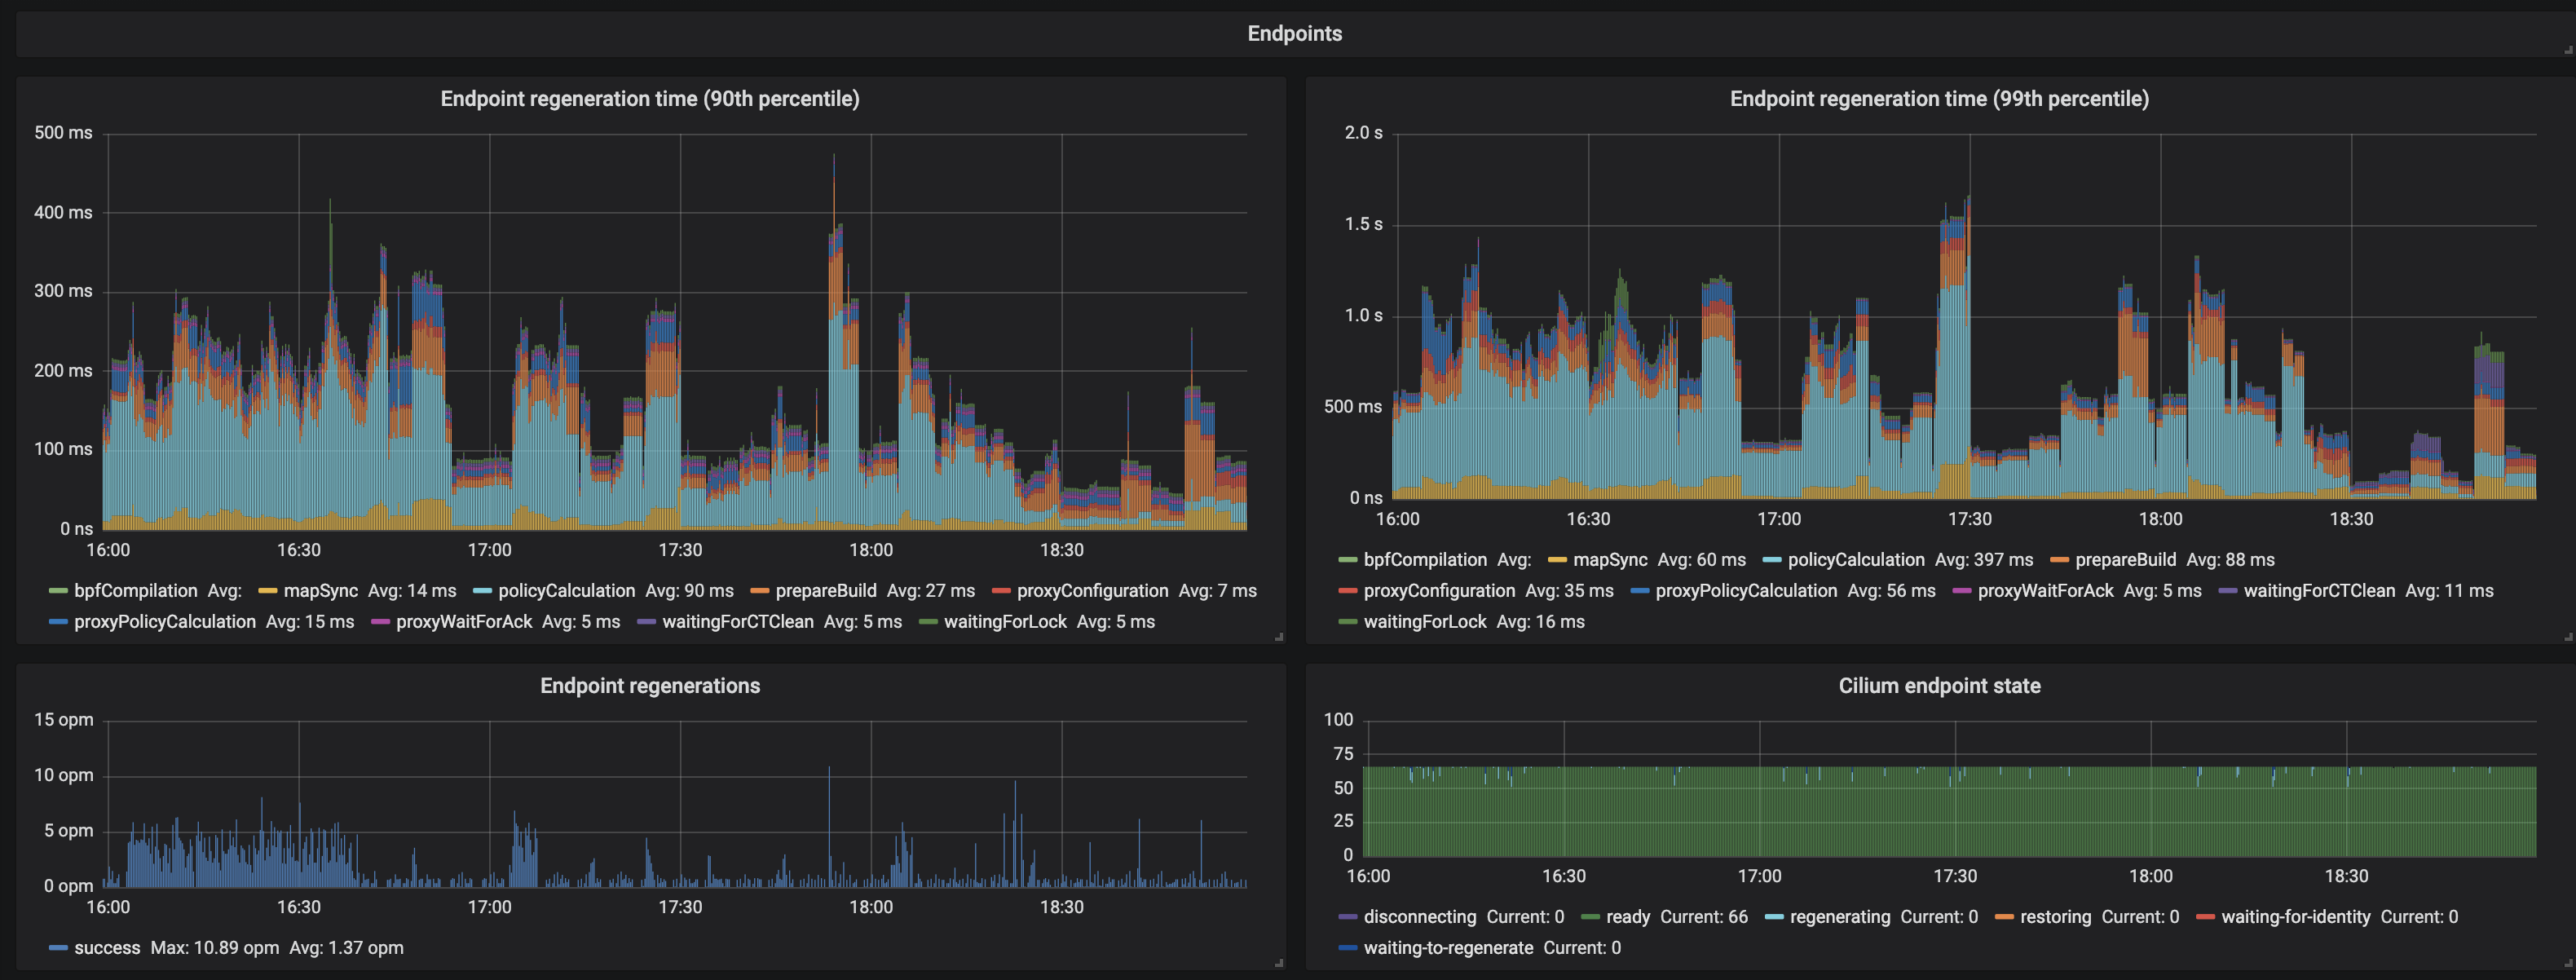
Endpoints
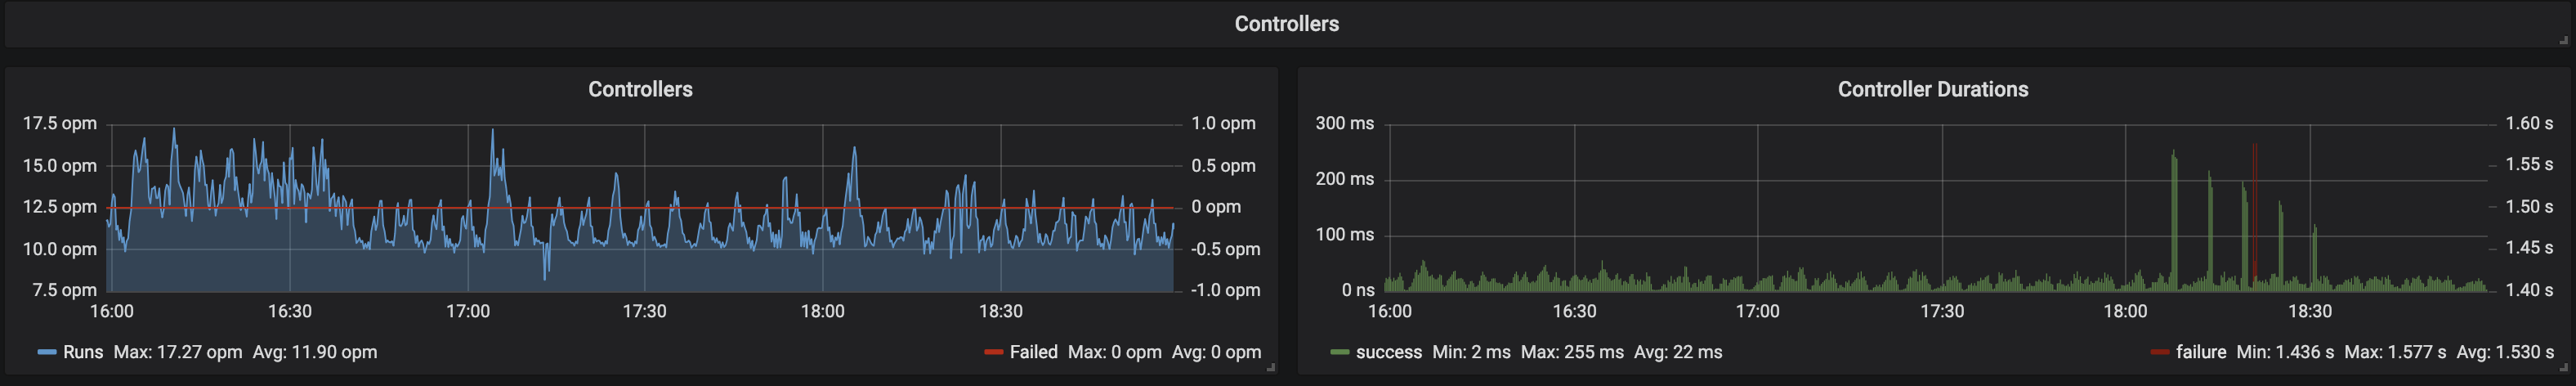
Controllers
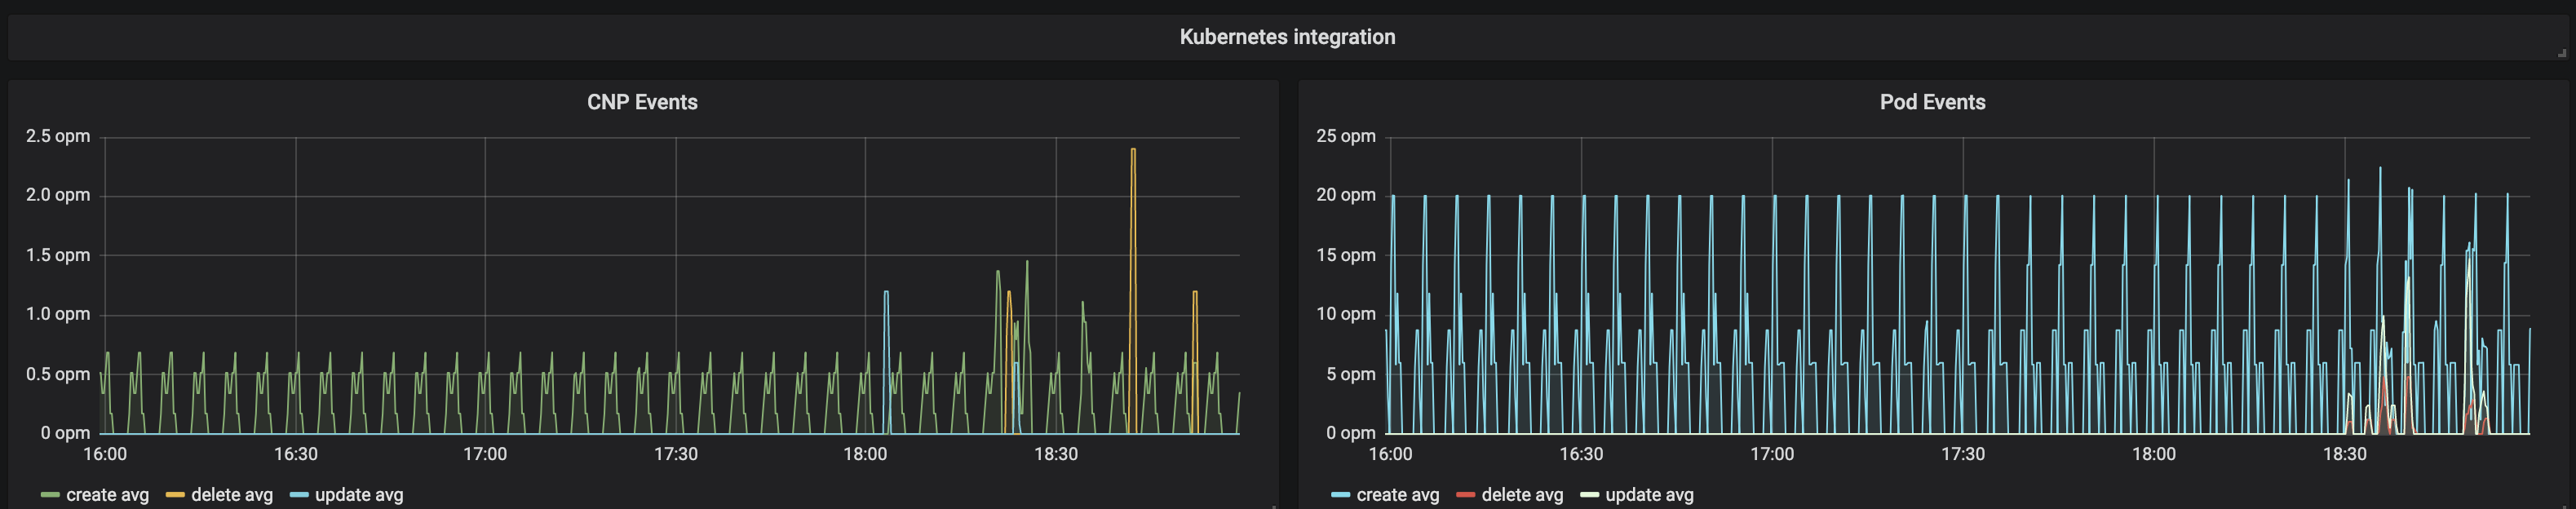
Kubernetes
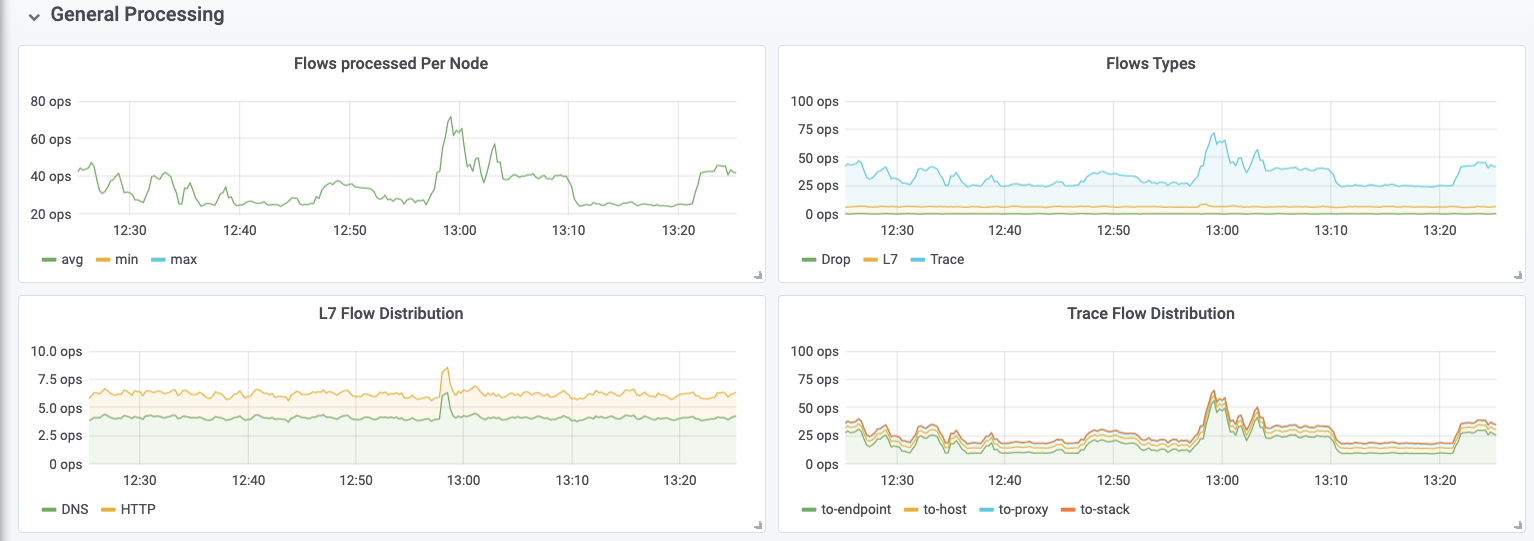
Hubble General Processing
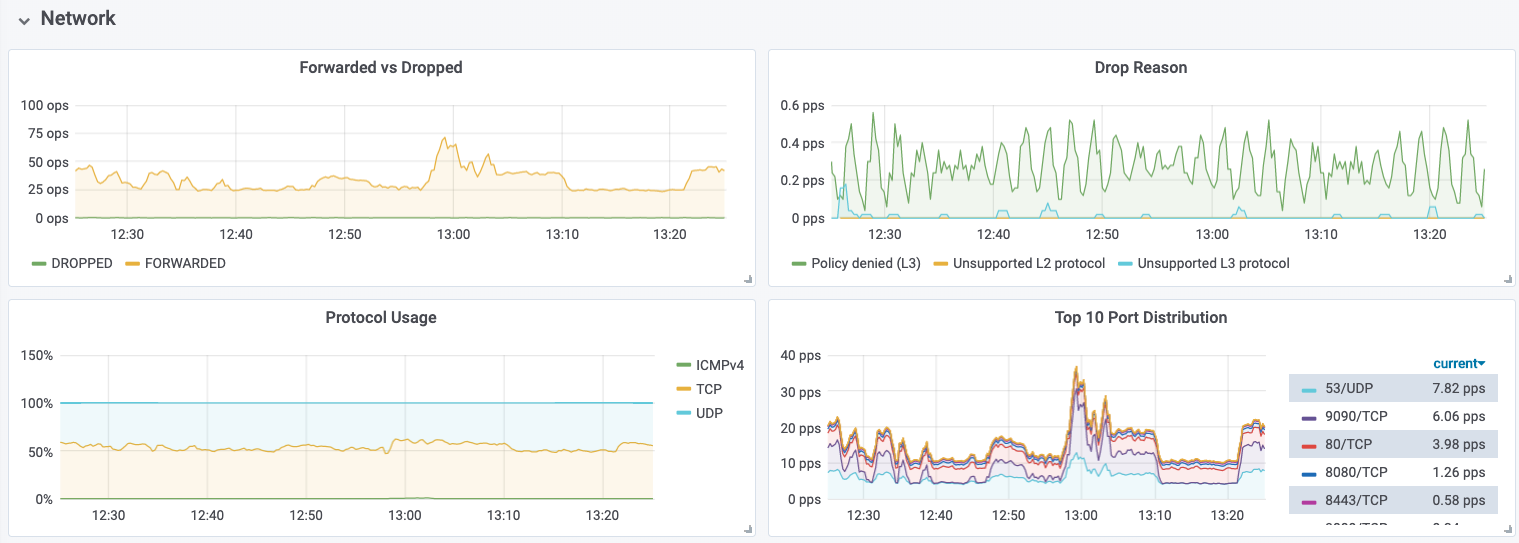
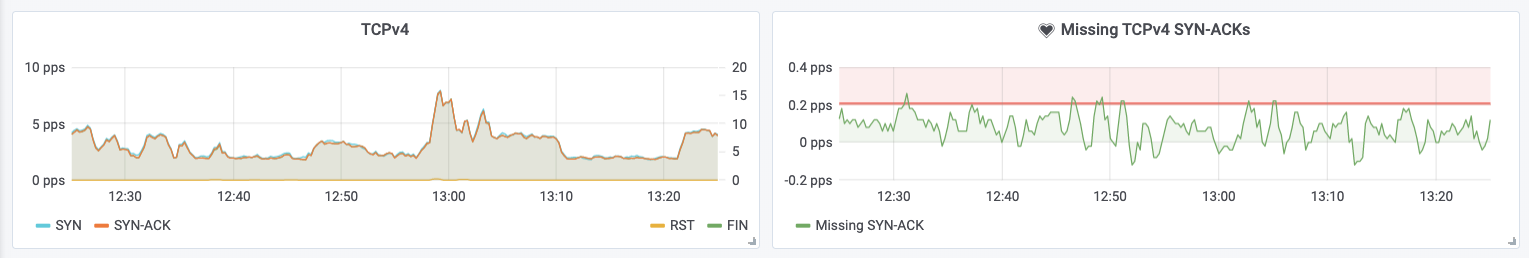
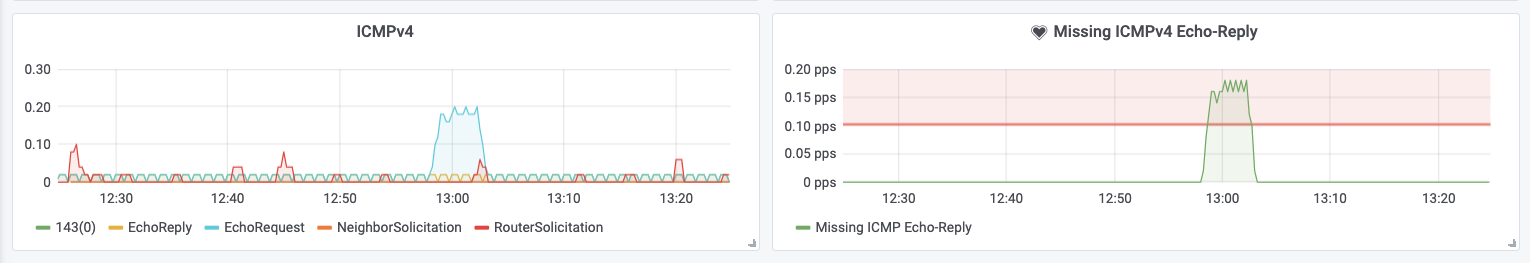
Hubble Networking
Note
The port-distribution metric is disabled by default.
Refer to Monitoring & Metrics for more details about the individual metrics.
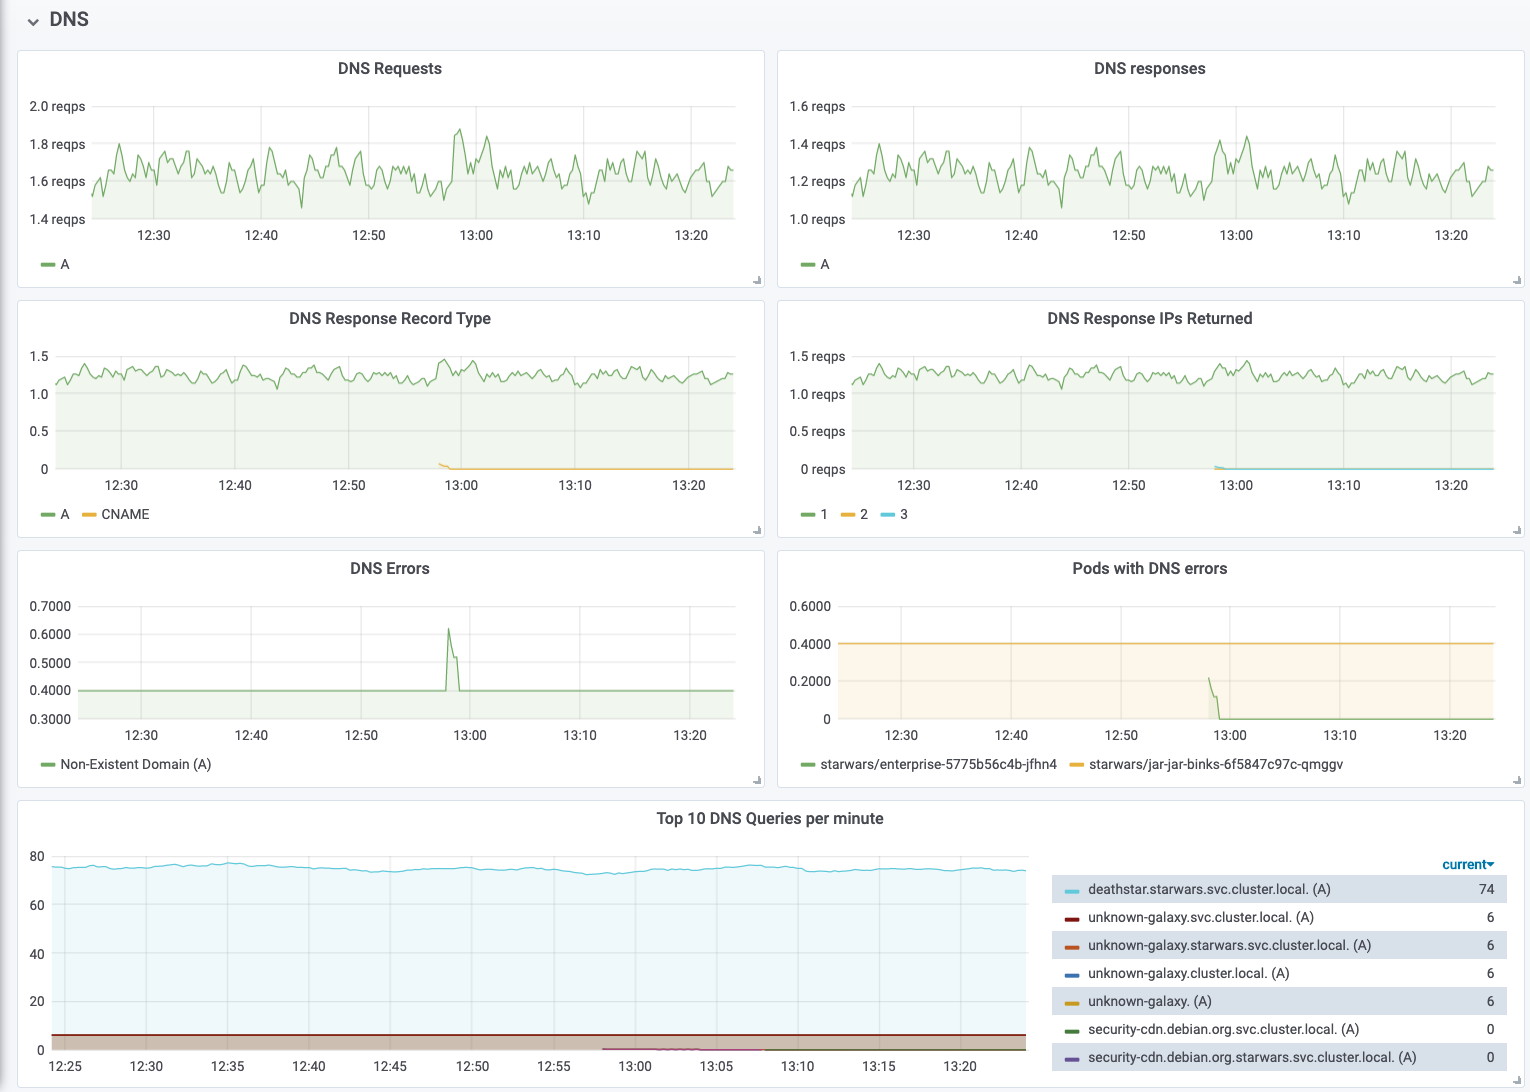
Hubble DNS
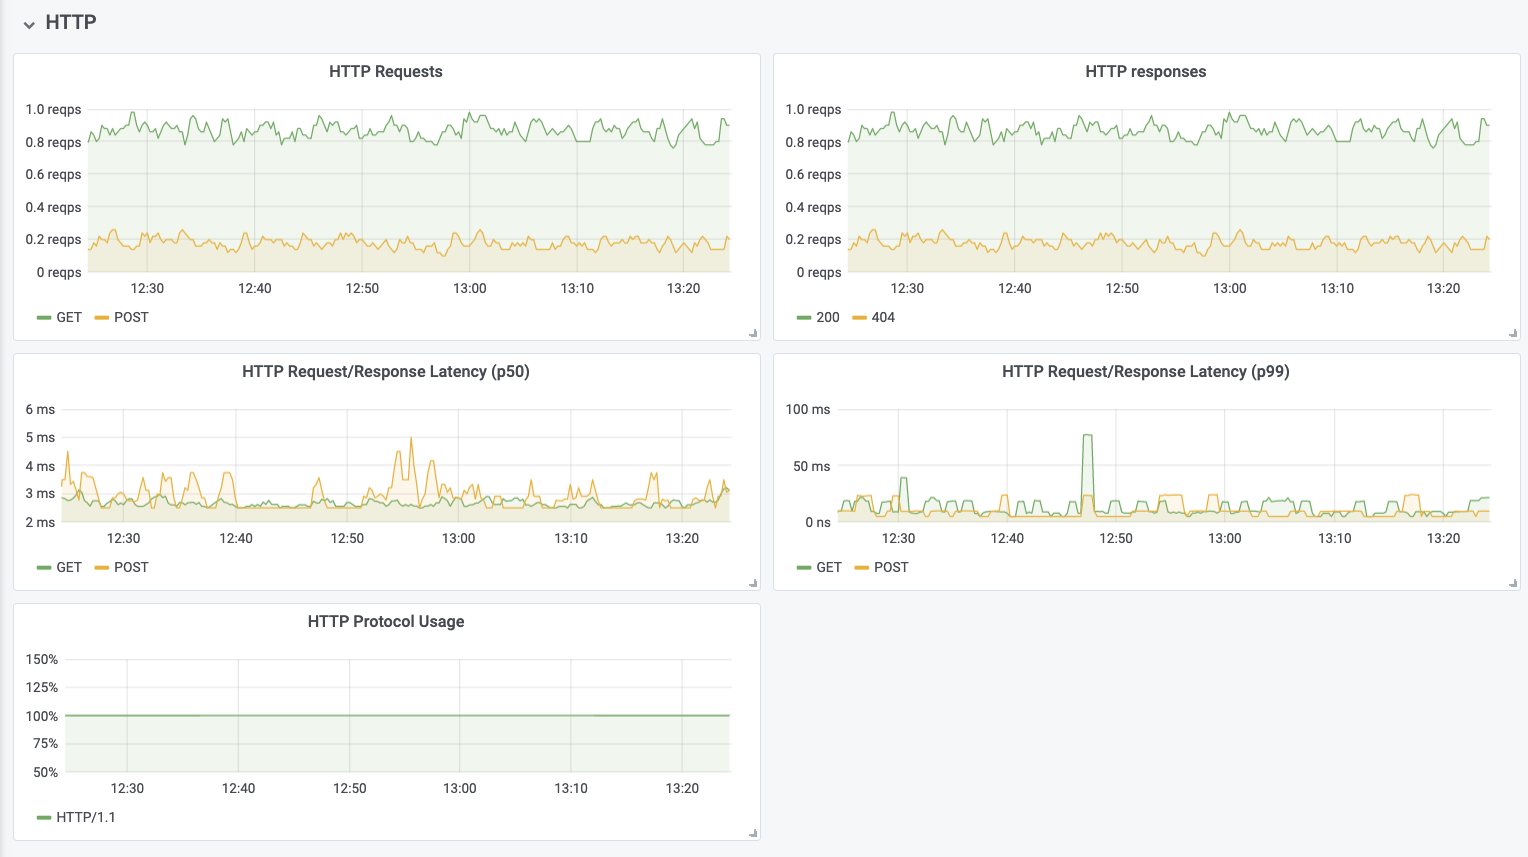
Hubble HTTP
Hubble Network Policy